Learn about Simi
Monitoring
The Monitoring section provides a real-time overview of your SIMI workspace, allowing you to track agent activity, system performance, usage statistics, and recent interactions.
Watch the video above to see the Monitoring section in action and learn more about how it works.
Workspace Statistics
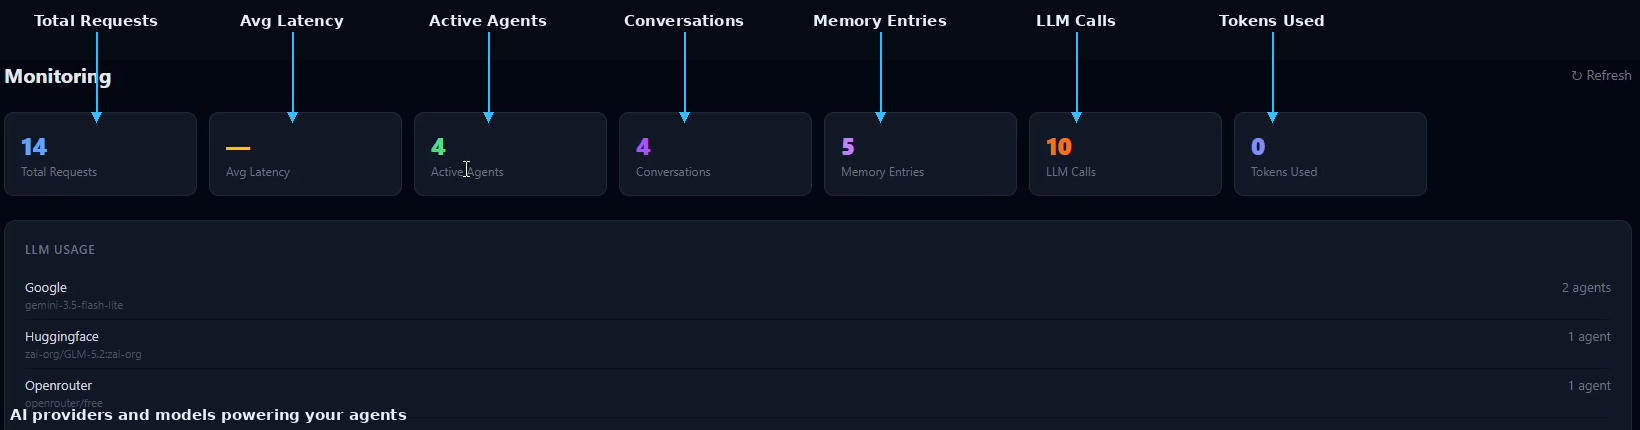
- The dashboard displays key statistics for your entire SIMI workspace, including:
- Total number of agent requests.
- Average request latency.
- Total number of agents created.
- Total number of conversations.
- Total memory entries.
- Total LLM calls.
- Total tokens used across all agents.
- These metrics help you monitor system performance, resource usage, and overall AI activity.
AI Providers & Models
- The middle section of the dashboard displays:
- AI providers used by your agents.
- The specific AI models assigned to each provider.
- A quick overview of the technologies powering your AI agents.
- This makes it easy to identify which providers and models are currently in use.
Recent Activity
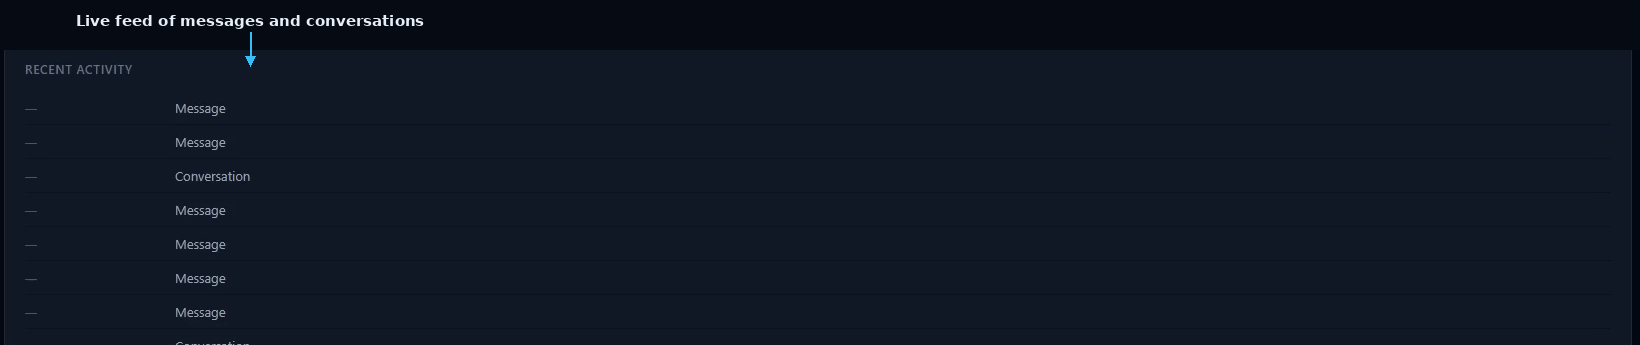
- The bottom section displays the latest activity across the platform. Recent activities include:
- Messages generated by individual agents.
- Conversations between multiple agents.
- Other recent interactions within the SIMI workspace.
- This activity feed helps you monitor what is happening across your AI environment in real time.
Key Features
- Monitor overall workspace performance.
- View request and latency statistics.
- Track conversations, memory usage, and token consumption.
- See which AI providers and models are active.
- Monitor recent agent activity and conversations.
- Gain real-time insights into your AI workspace.
Try Monitoring in SIMI
Explore Monitoring and the rest of SIMI's multi-agent workspace for yourself.
Explore SIMI